
Aug 27, 2026
How Record Keeping Became Writing
Philadelphia has many libraries. In its biggest Library, Parkway Central, there is a quiet room on the fourth floor dedicated to rare books...
Philadelphia has many libraries. In its biggest Library, Parkway Central, there is a quiet room on the fourth floor dedicated to rare books...
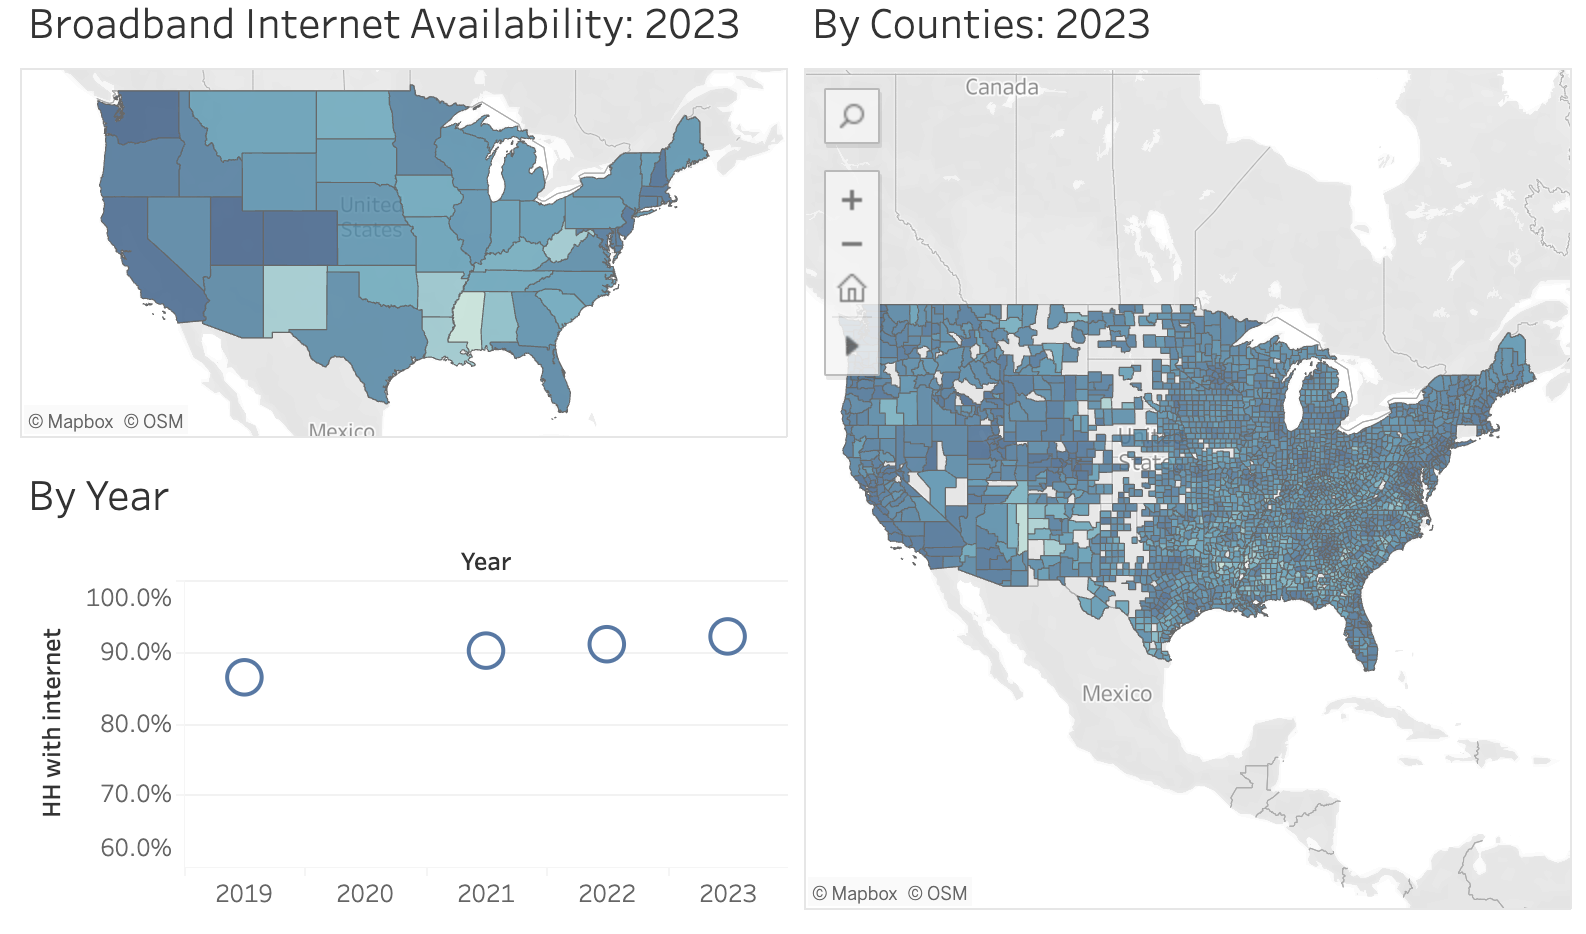
Each year the Census Bureau collects statistics on internet availability through its American Community Survey. This dashboard visualizes trends in internet access by state and county.
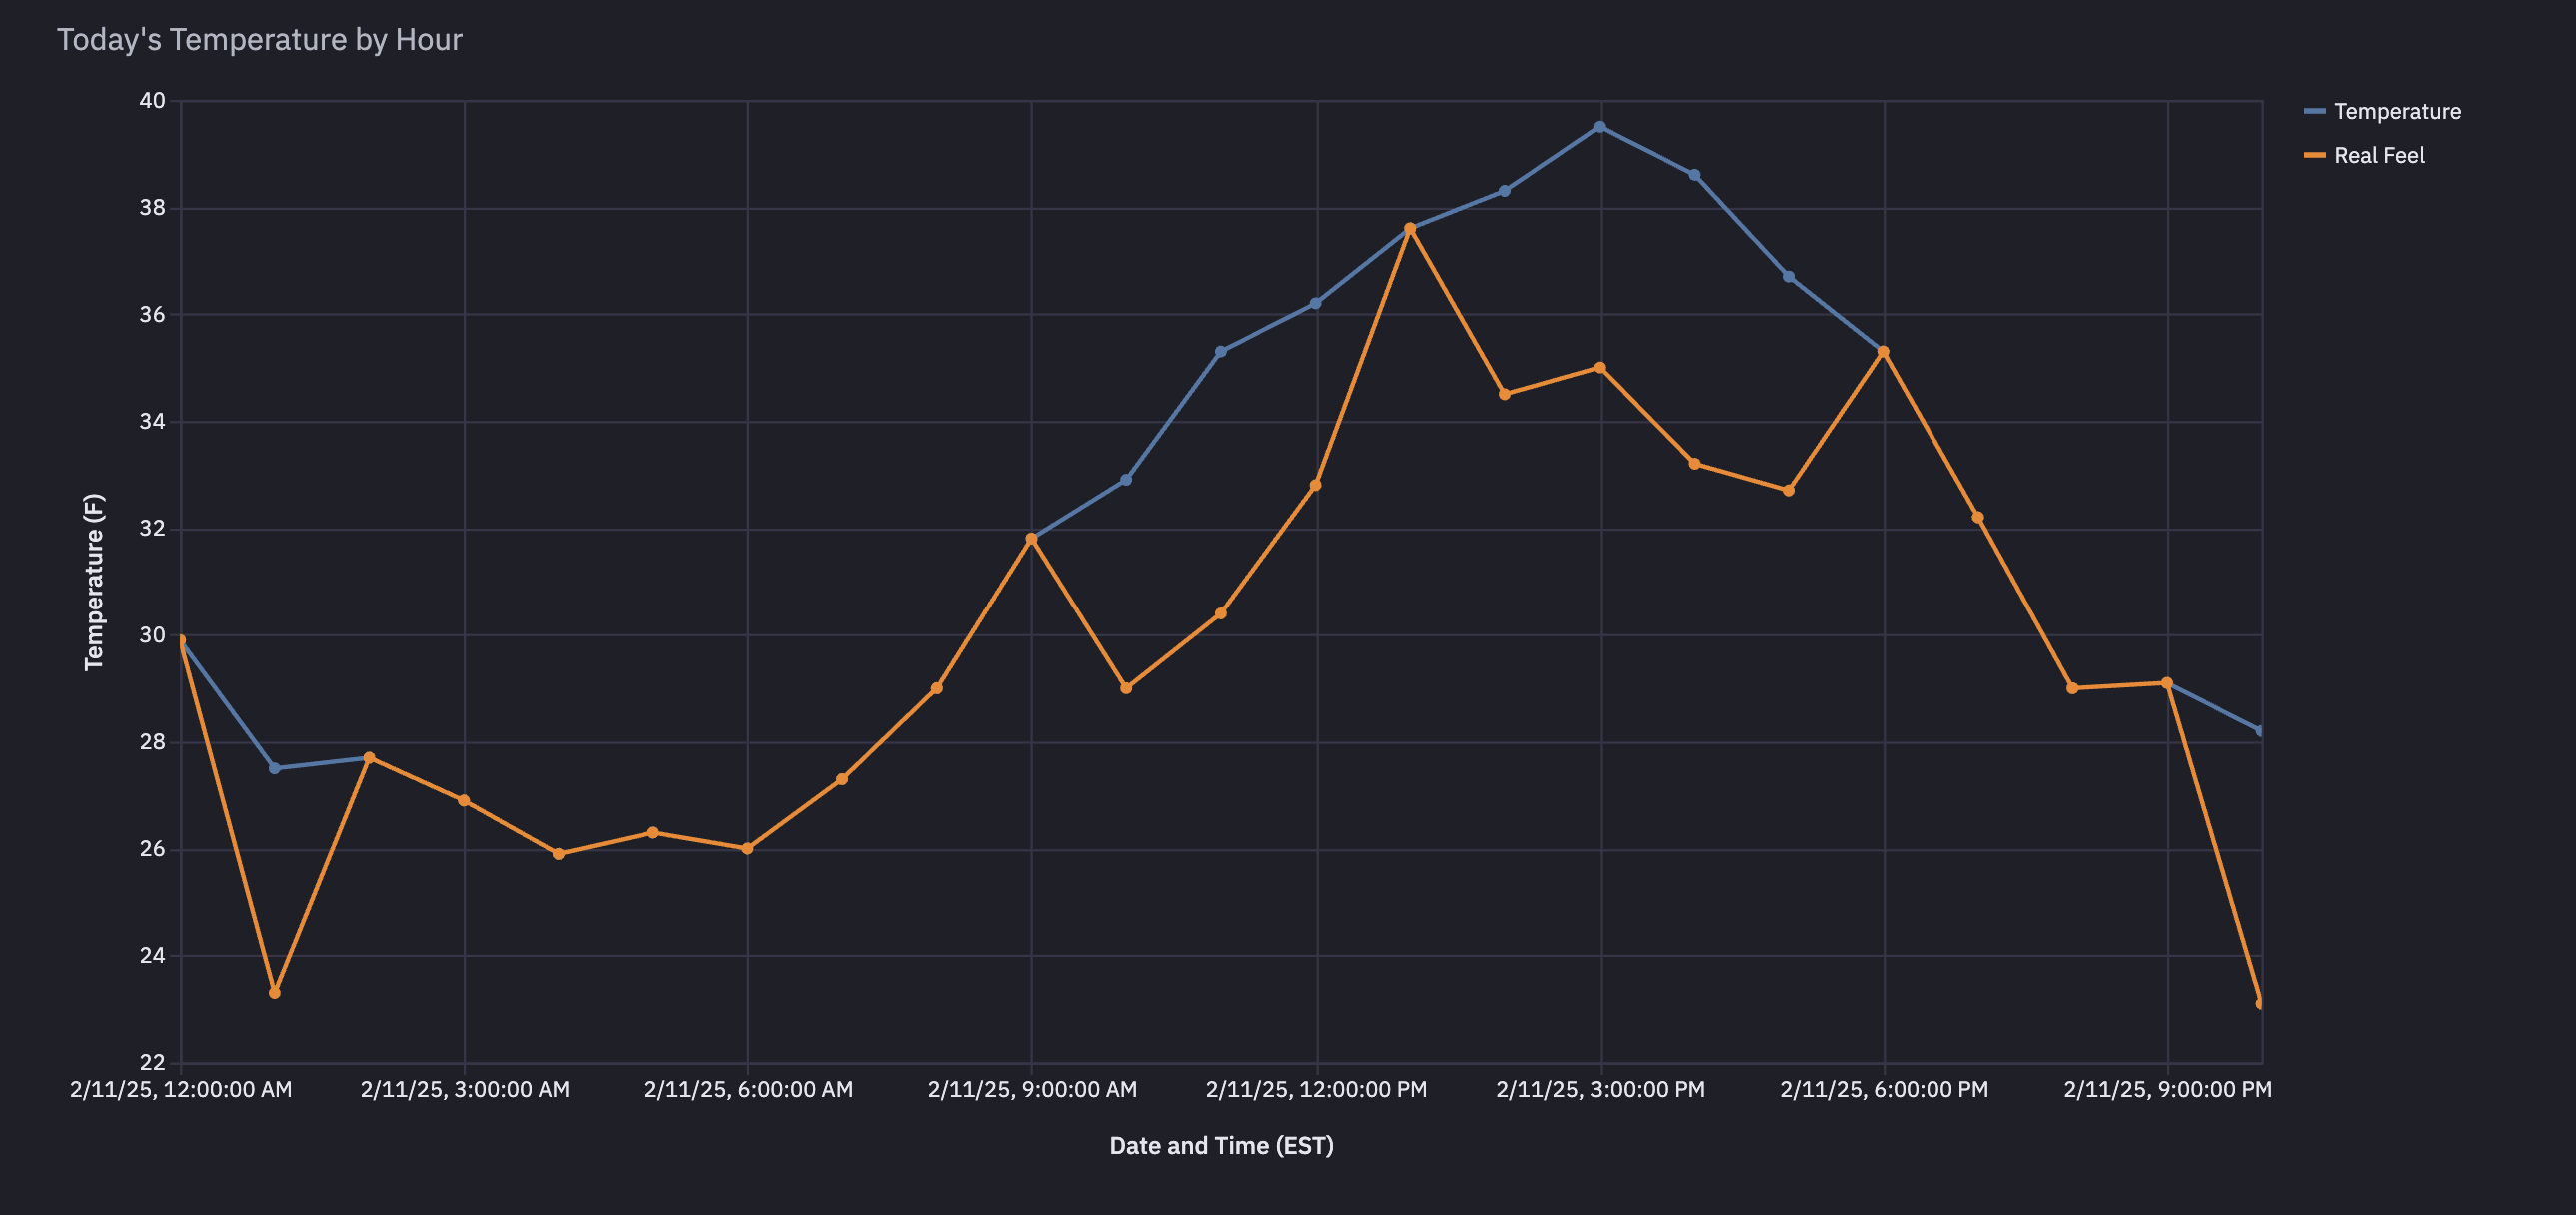
To feed my weather obsession, I built a pipeline that tracks Philadelphia weather each hour — using Prefect, Modal Labs, MotherDuck, and Hex
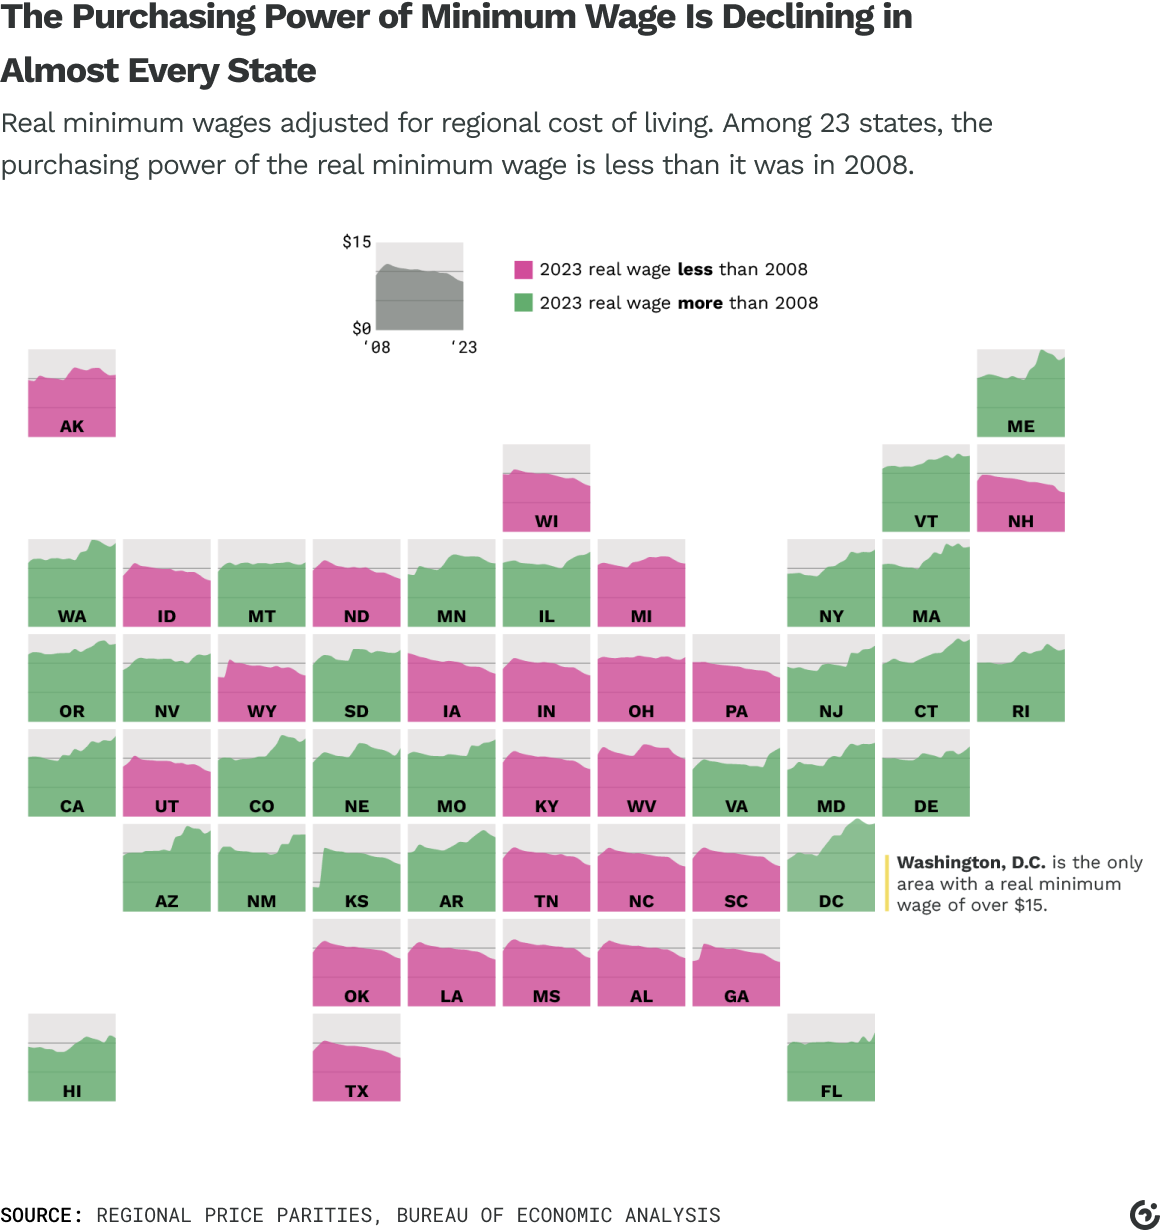
Efforts to raise the federal minimum wage have stalled in Congress. As a result, its purchasing power can’t keep up with inflation and high cost of living in many parts of the country.
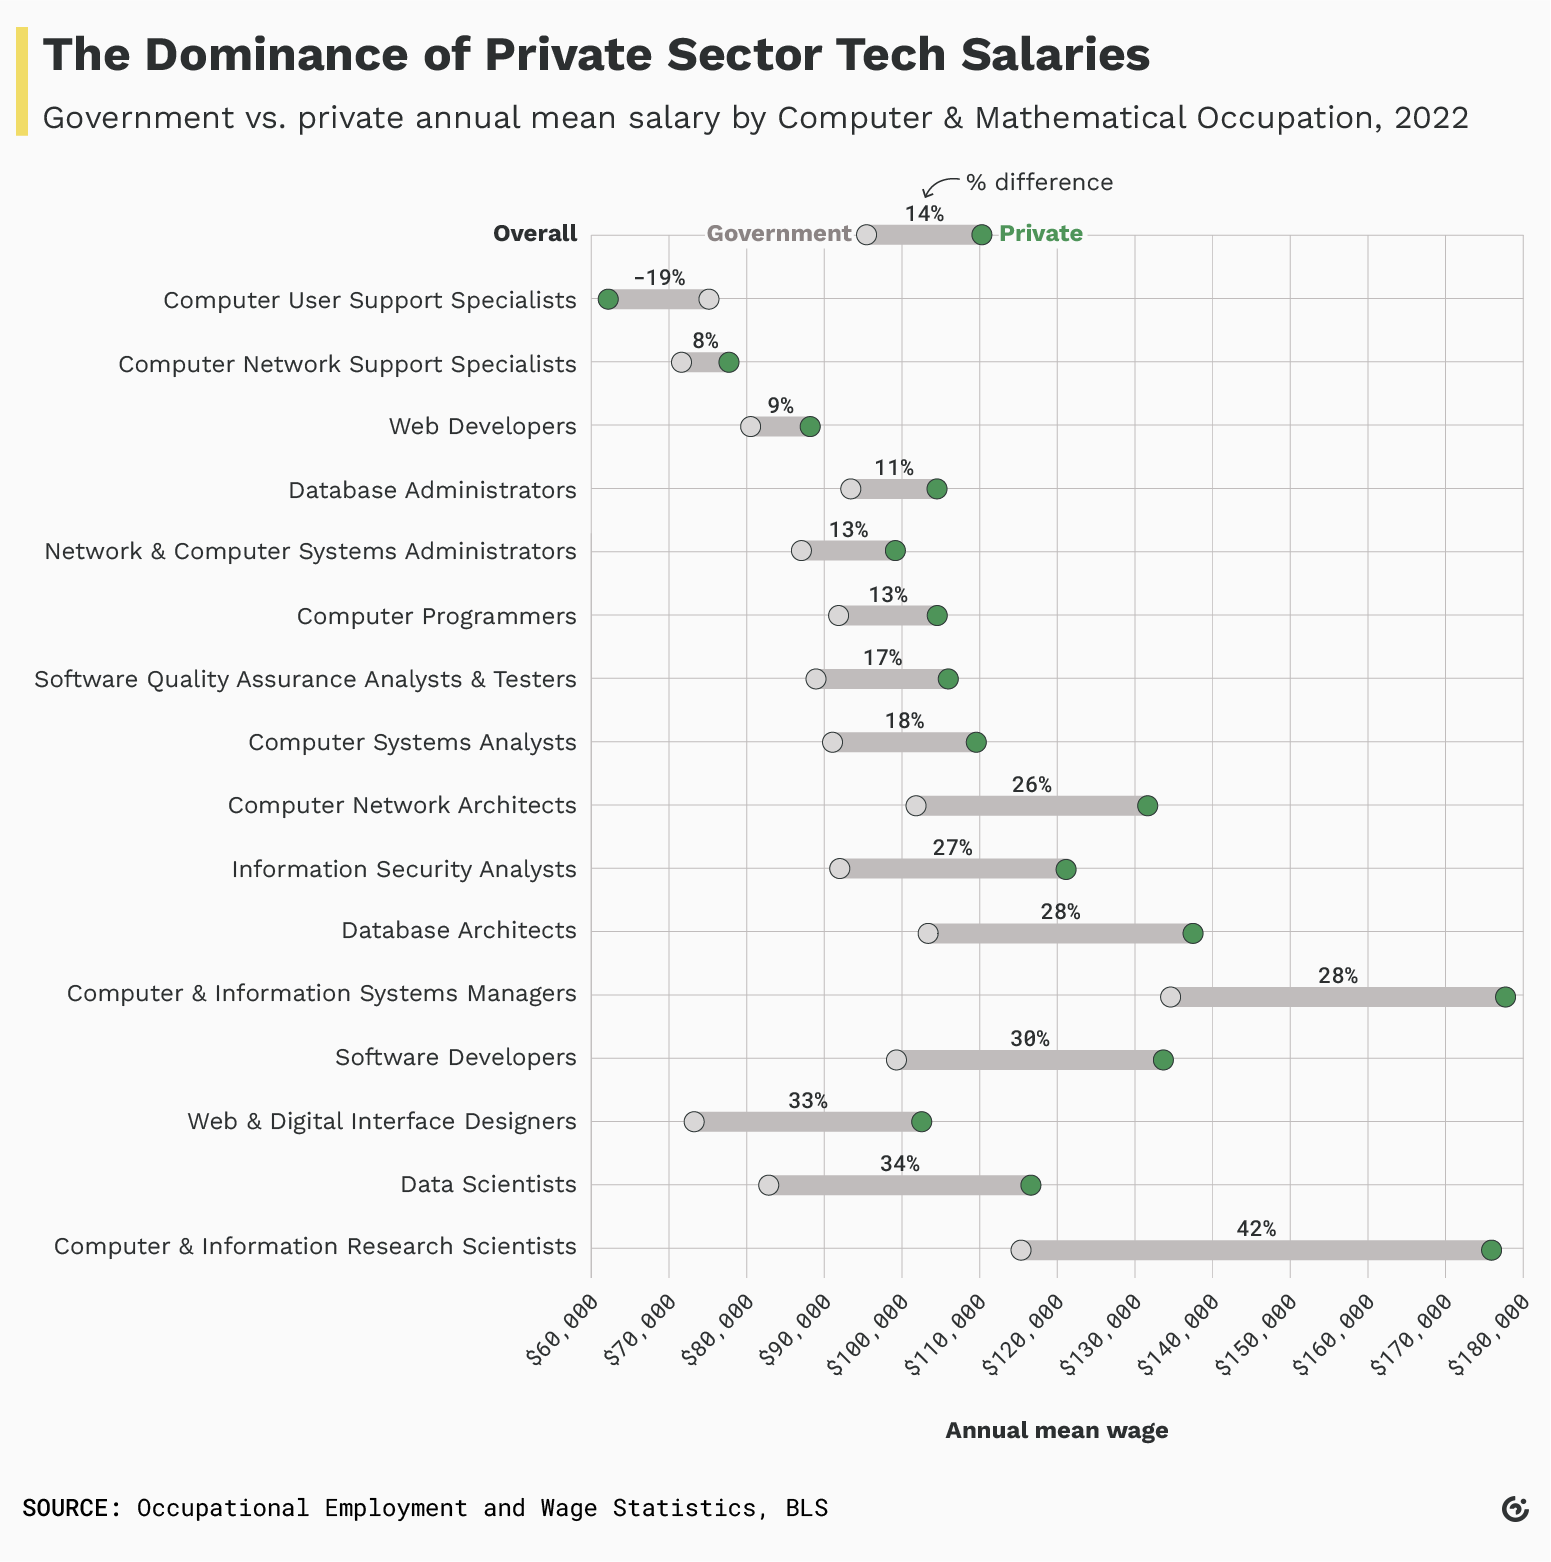
The federal government seeks top tech talent. But they struggle to compete with private-sector wages.

Could efforts to improve federal data collection in U.S. territories help make the American public care more about their 3.6 million residents?
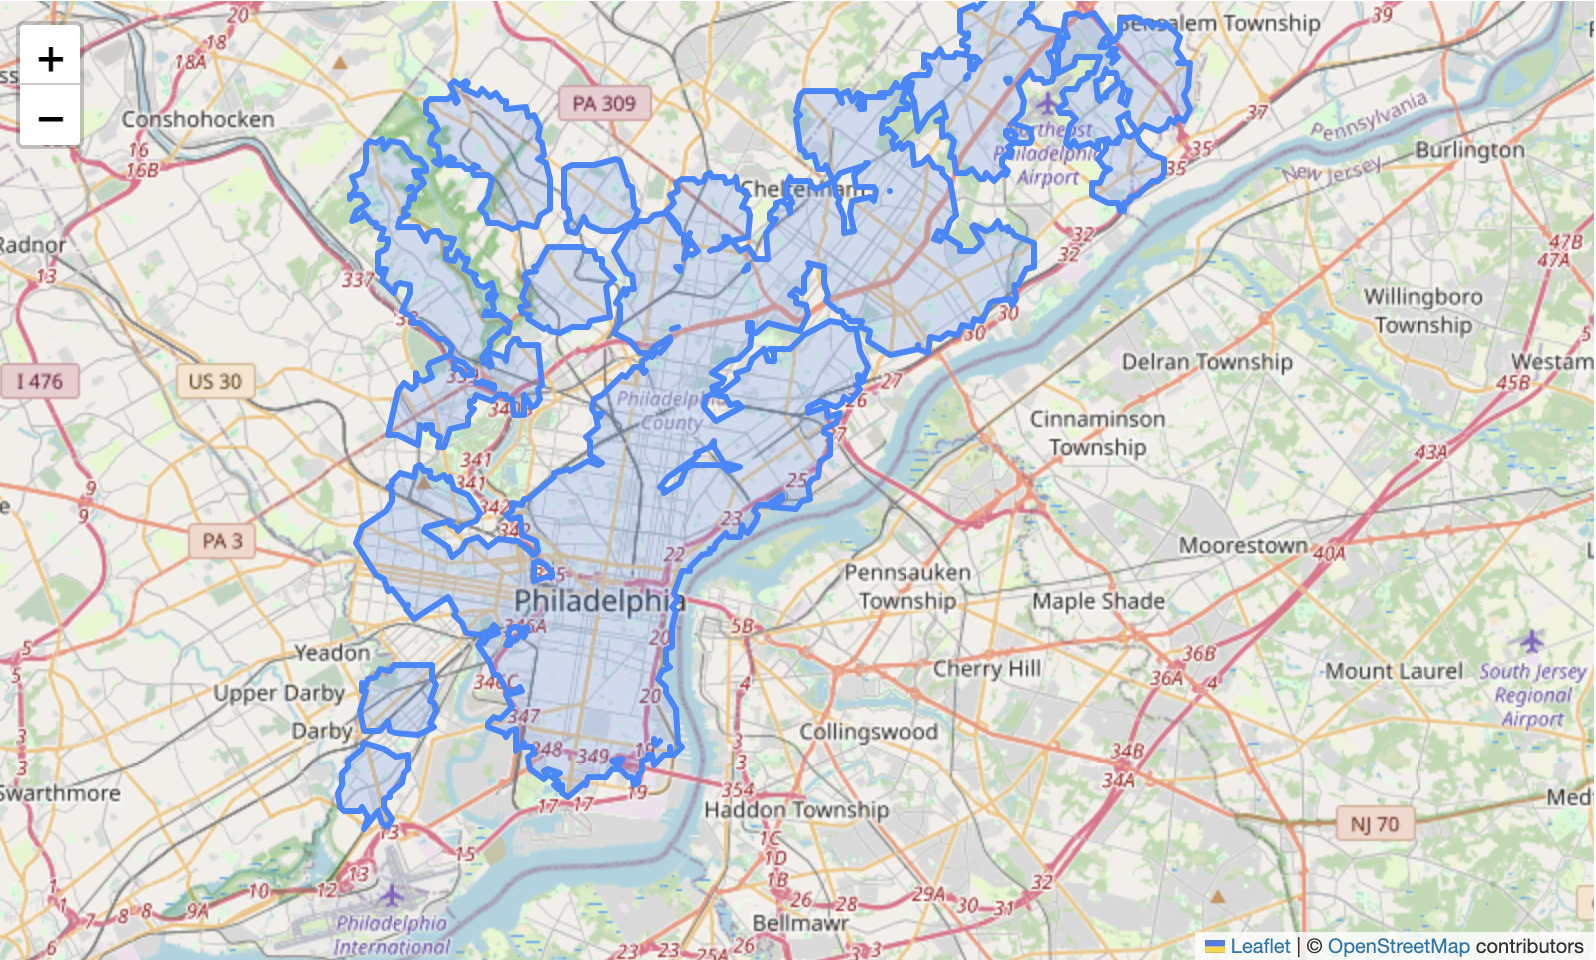
Areas without banks are known as "bank deserts." To measure them in Philadelphia, I calculated the 15-minute walking zones around every FDIC-insured bank.
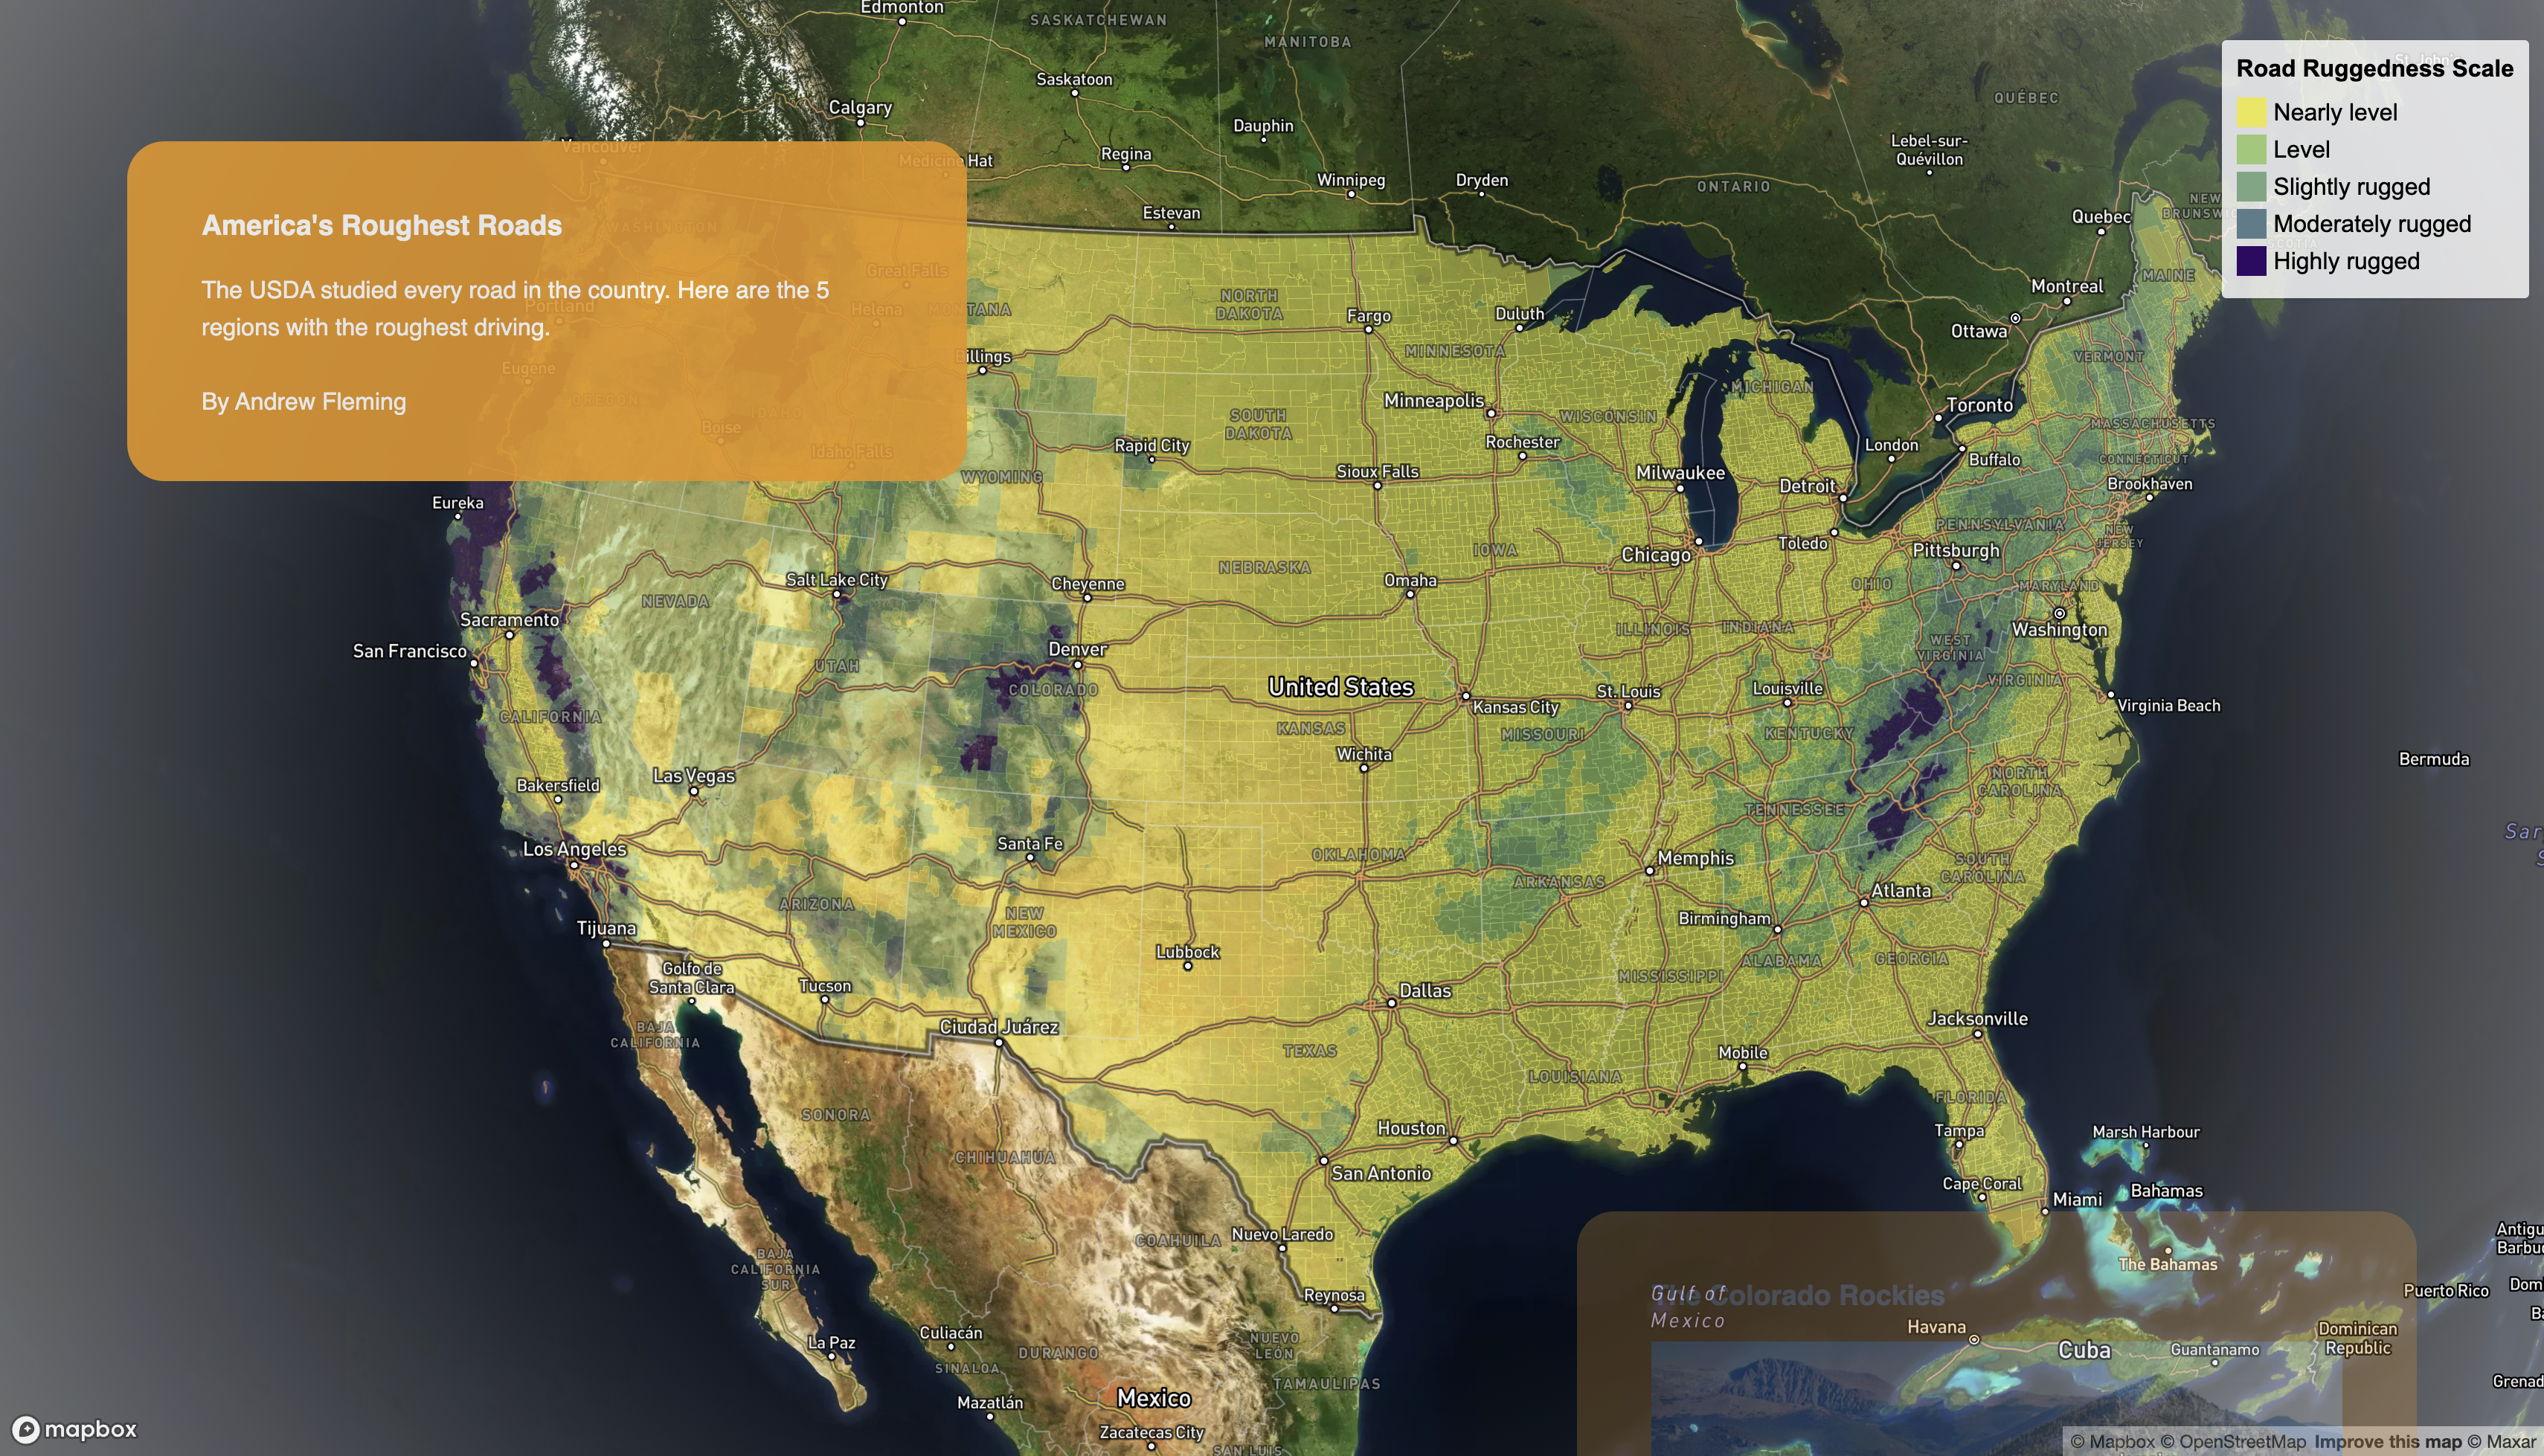
The USDA studied every Census tract in the U.S. to understand the ruggedness of its roads. Using Mapbox's 3D terrain feature, we can visualize regions with some of the toughest driving.

The Census Geocoder API turns addresses into a wealth of geographic information — but it misses a lot of addresses. Here is how to fill the gaps with the Mapbox API.
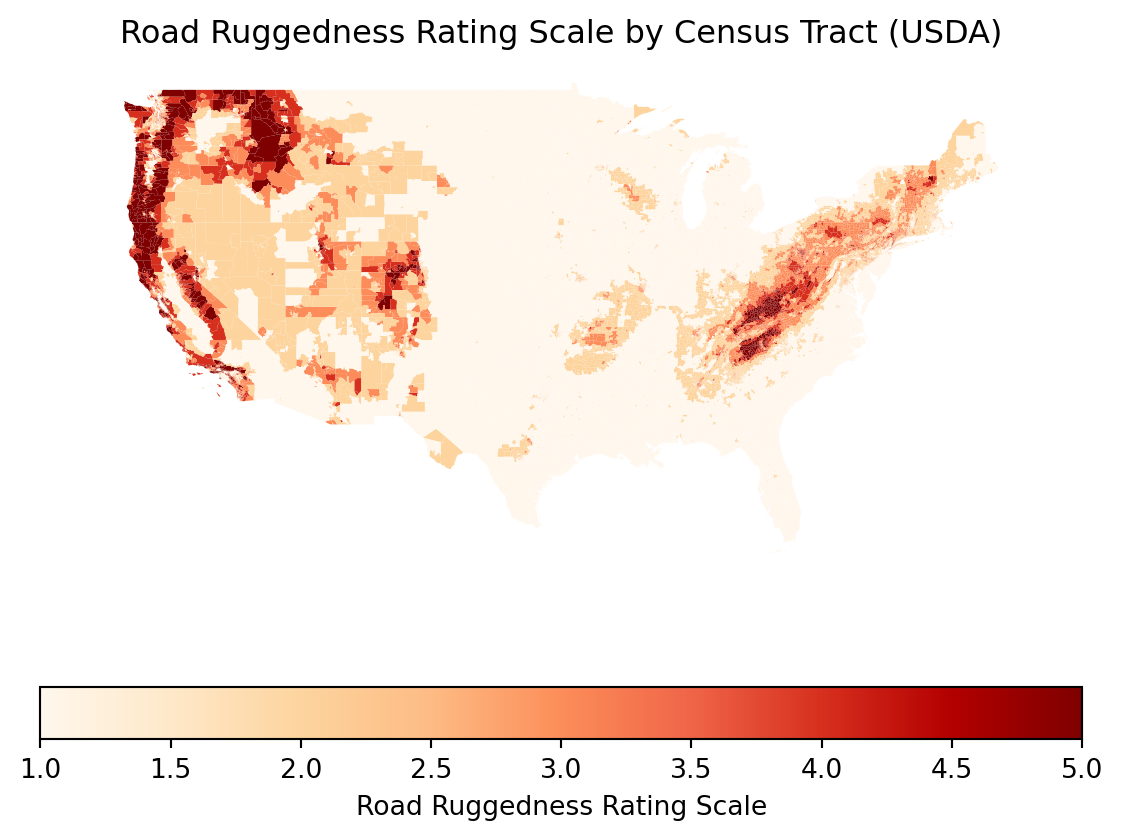
U.S. government datasets are often released without accompanying geospatial data. Python libraries like GeoPandas and pygris make it easy to locate the geo data you need to map your analysis.
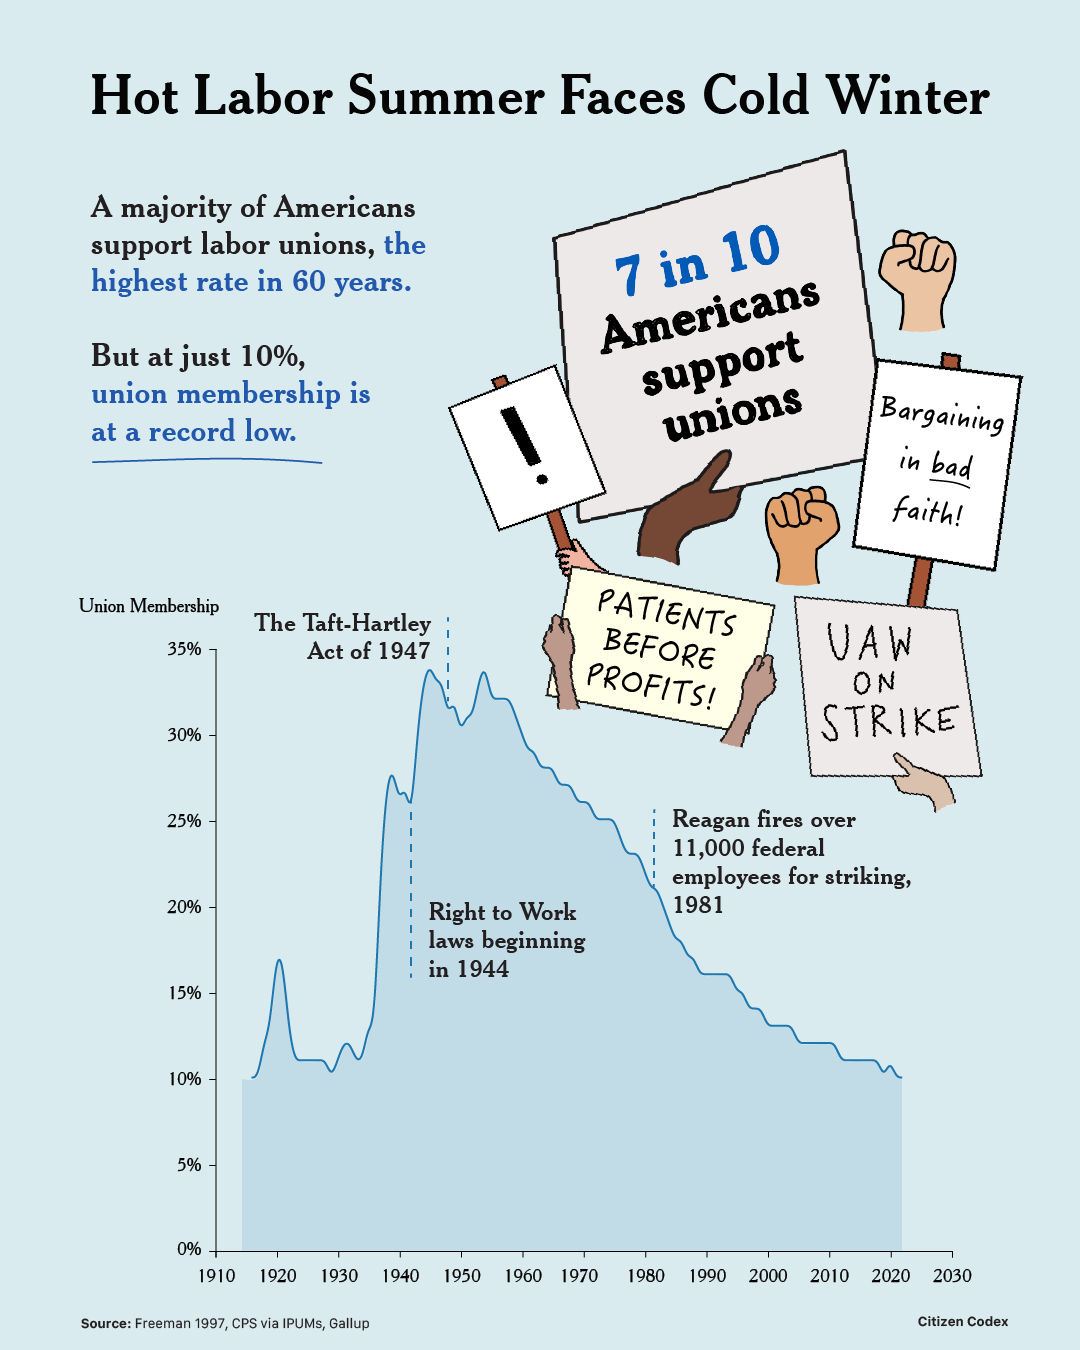
Over the past several decades, corporations and U.S. policies have largely stomped out unions. Will a series of historic labor wins and record public support reignite their flame?
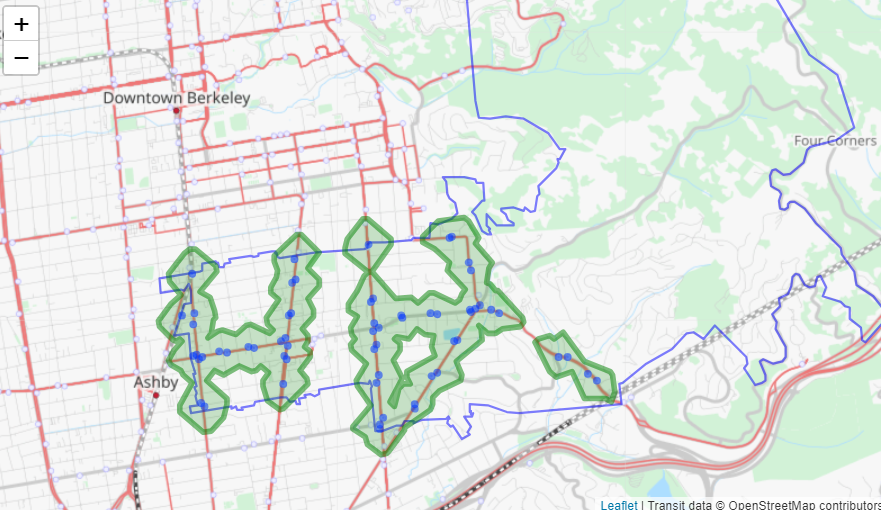
Using R and the Mapbox API, you can map the walking zones ("isochrones") around any set of points — like every bus stop near a South Berkeley ZIP code — and overlay apartment listings.
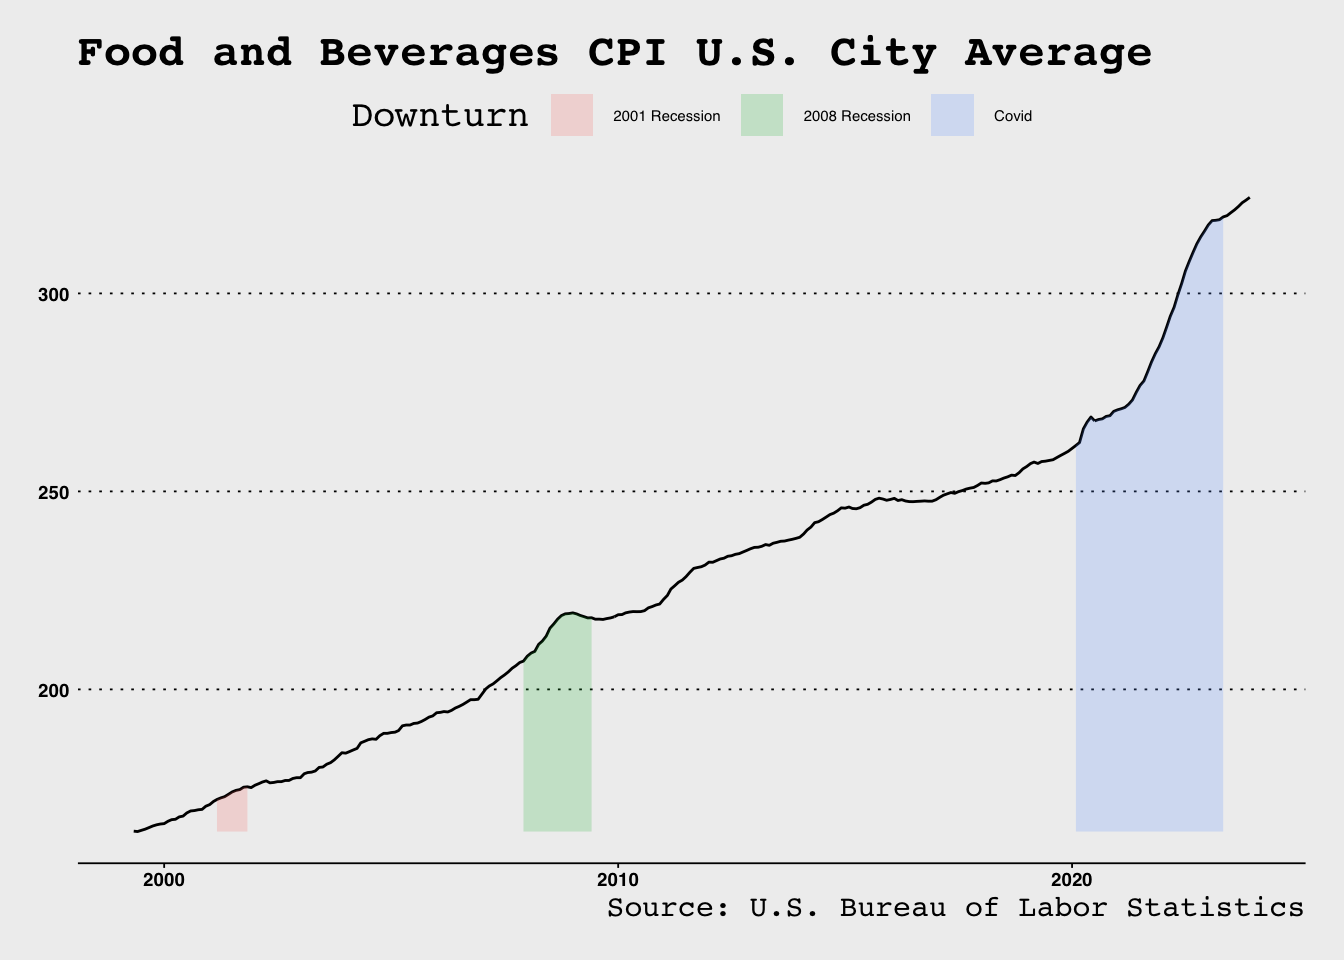
The St. Louis Federal Reserve aggregates U.S. economic data in an easy-to-access database called FRED. Here is how to pull it straight into R and build your own visualizations.
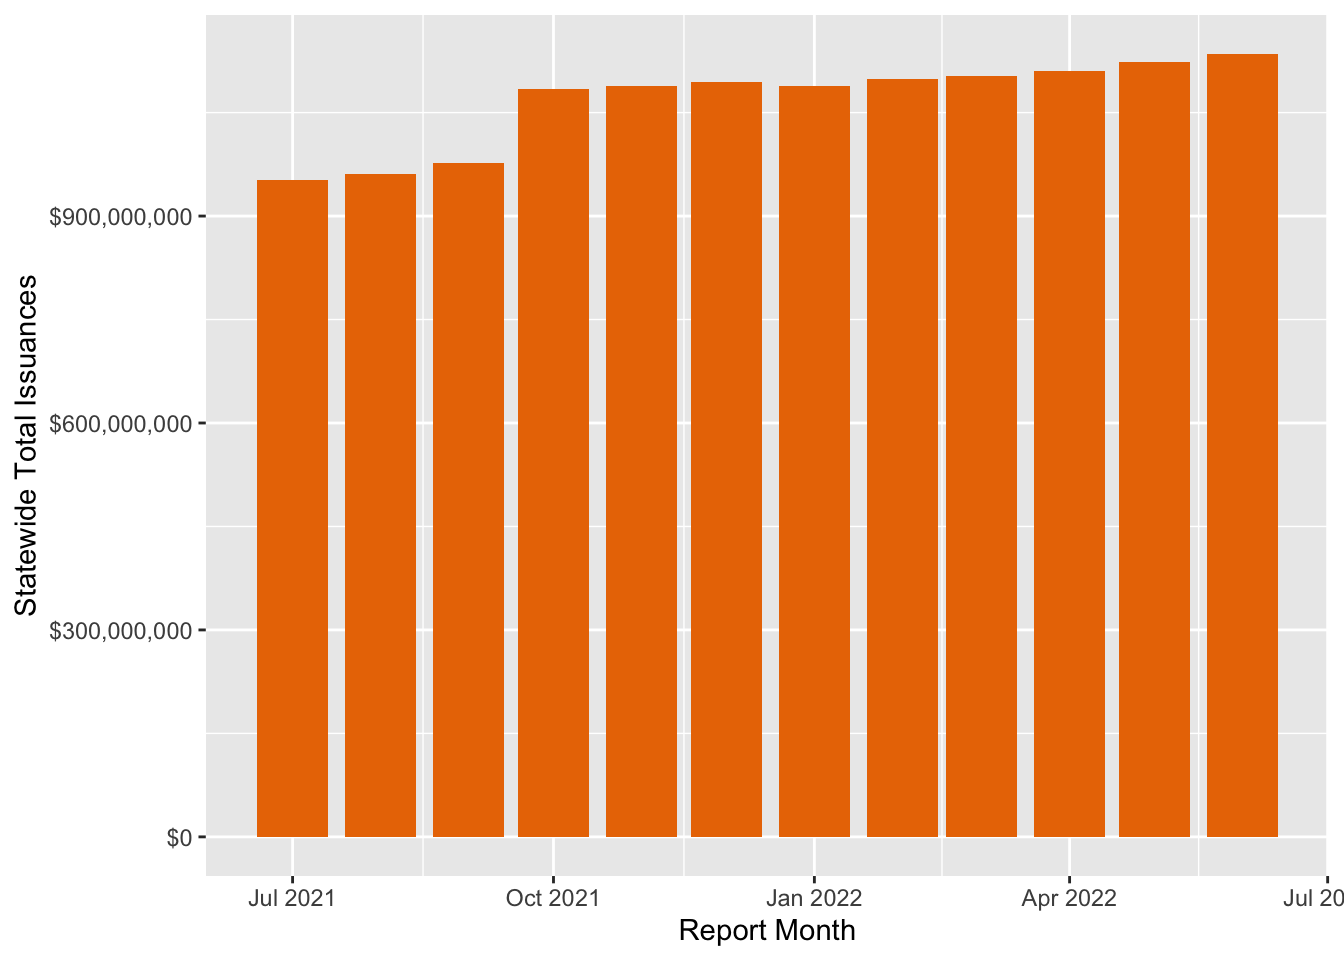
A walkthrough of using R to analyze the macro-economic effects of CalFresh (SNAP) in California — adjusting for inflation and mapping GDP and job growth by county.