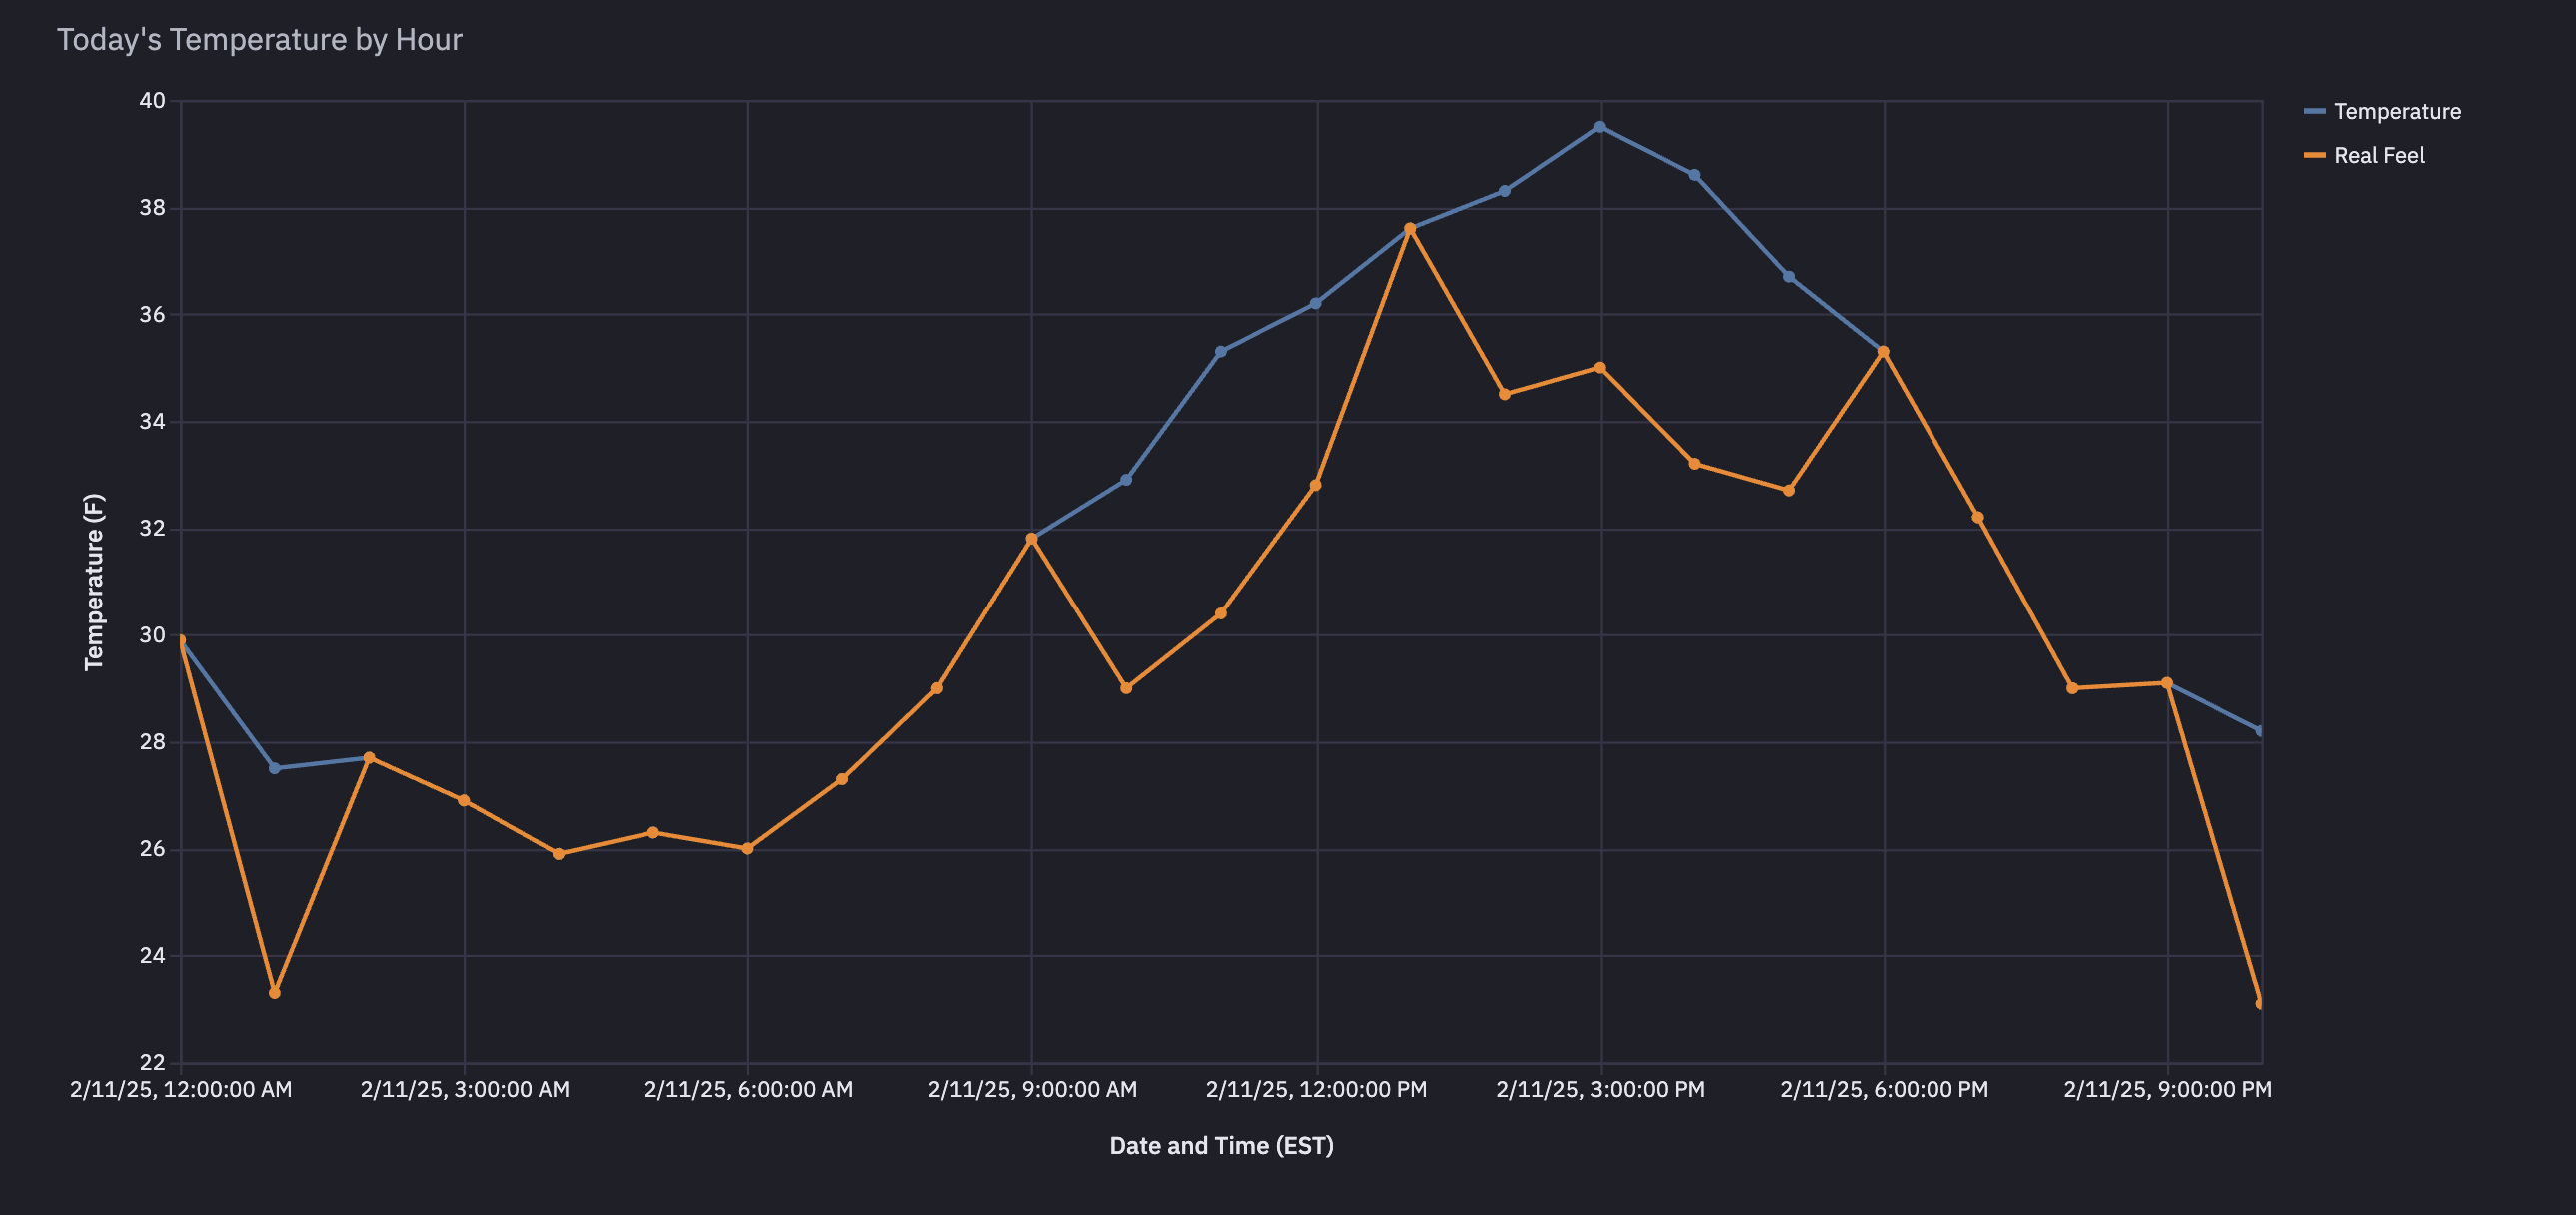
I am forever curious about the weather. I check my phone at least once an hour to see how it’s looking outside. I also poke my head out the door to make sure what’s going on outside aligns with what my phone says. My favorite moments are when I know it’s raining but my phone doesn’t.
To support my weather obsession, I built an application to track the hourly weather in my home city of Philadelphia. The project presented me with the fun opportunity to build a data pipeline that runs a script each hour, stores the results, and visualizes the data. You can check out the final dashboard here: Weather Dashboard
I decided to build my weather pipeline using four innovative new tools:
| Data Pipeline Piece | Purpose | Tool |
|---|---|---|
| Data Orchestrator | Trigger tasks at scheduled times | Prefect |
| Virtual Compute | Run tasks in the cloud | Modal Labs |
| Data Warehouse | Store and query data | MotherDuck |
| Business Intelligence | Visualize data | Hex |
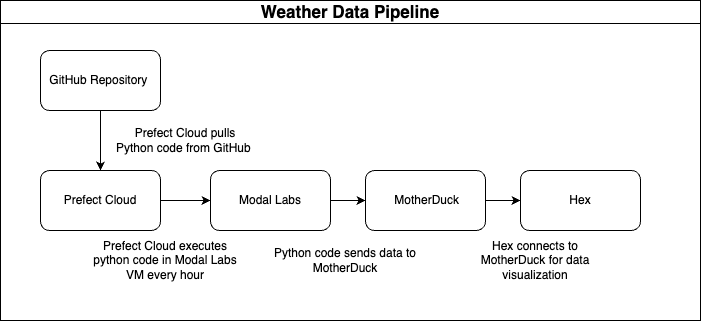
Each of these new tools simplifies data pipeline development. Prefect allows you to easily execute Python scripts on a schedule. Modal Labs allows you to run those scripts in the cloud without the hassle of provisioning cloud infrastructure. MotherDuck lets you set up a data warehouse in a matter of seconds. And Hex lets you build amazing dashboards with its managed notebooks. By combining these tools’ power, I was able to build a pipeline in a couple of days. And thanks to each platform’s generous free tier, everything runs at no cost.
The diagram below shows how the pieces of the pipeline fit together:
You can check out my Prefect flow on my GitHub: Prefect Weather Flow
Looking ahead, I am excited (1) to have constant access to weather trends, and (2) to apply this data pipeline framework to other use cases. As each piece of this framework is highly scalable, the possibilities are endless.